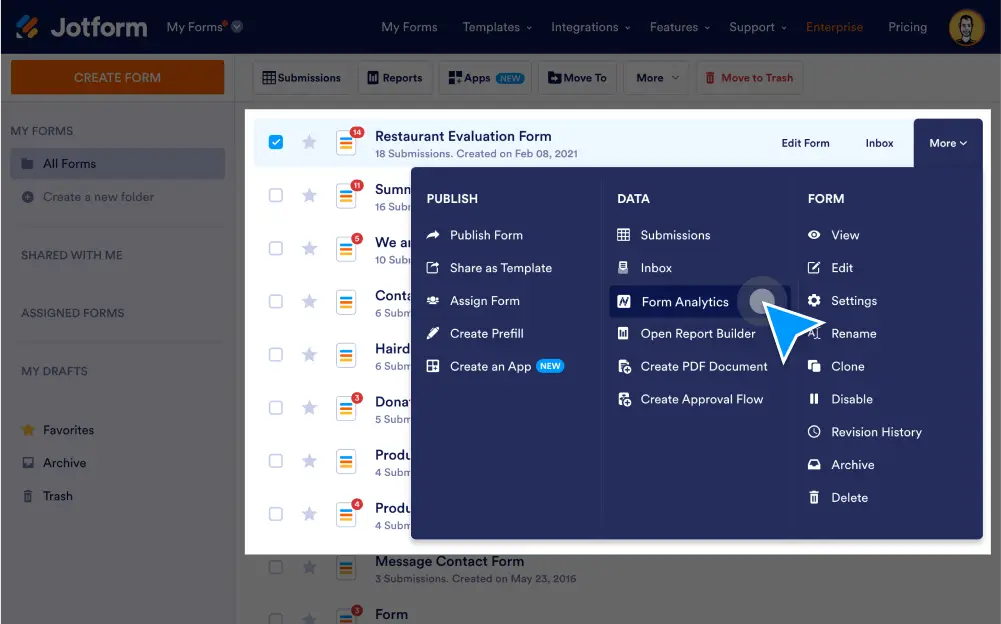
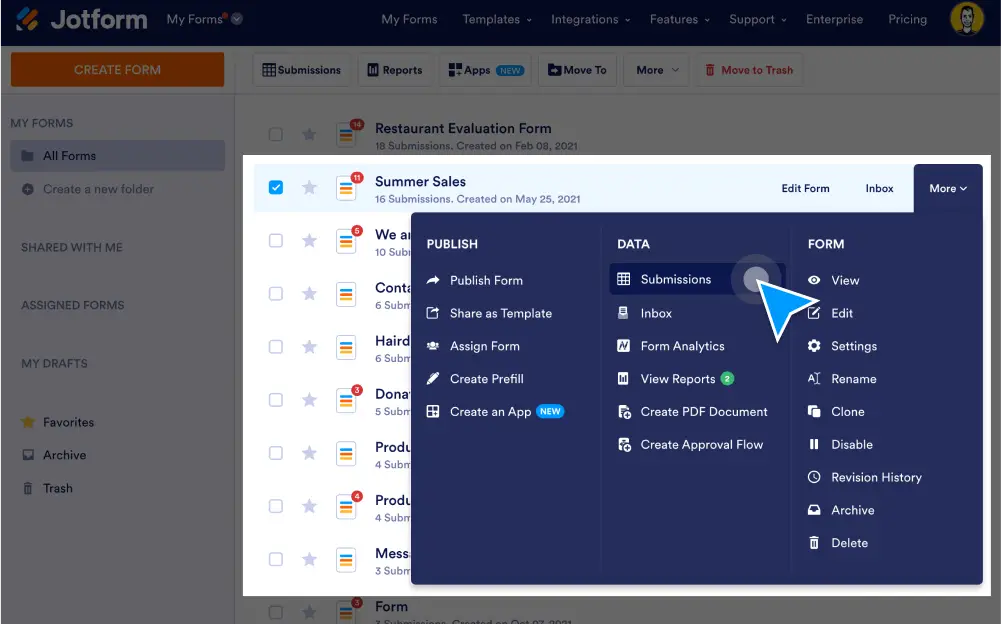
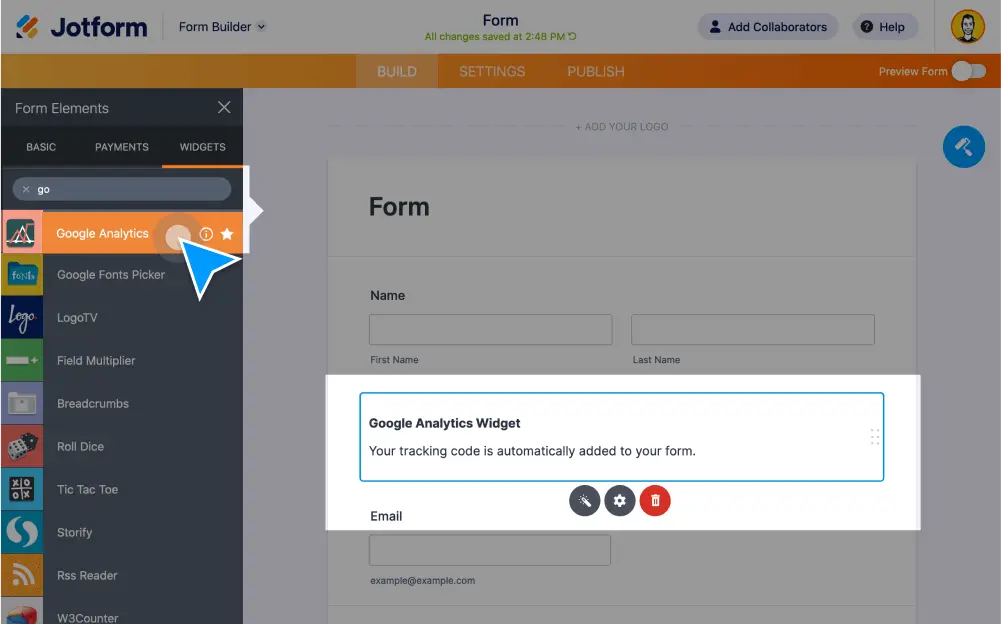
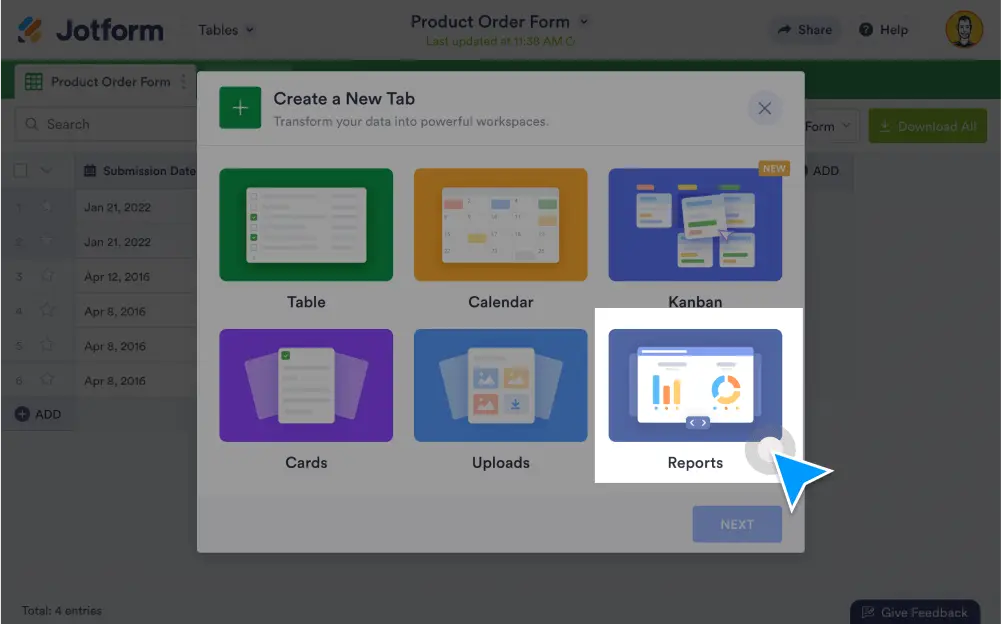
분석
Turn form submissions into visual reports using Jform Report Builder. Generate bar graphs, pie charts, and submission grids automatically. Analyze form data to make better decisions for your company.
Generate visual reports from your data without coding. Using Jform Report Builder, you can turn submissions into charts, import CSV or Excel data, set up search filters, and share, embed, or print your reports.
See your form data in a whole new way. Generate form reports using Jform Report Builder.
Convert form responses into visually stunning reports with customizable charts, graphs, grids, and more. Your automated report will immediately update after each new submission.
Get an instant summary of your submissions. View results in an automatically generated bar chart, which you can change to a donut, pie, or column chart.
Visualize your data in just one click. Transform form submissions into bar graphs, pie charts, grid lists, and more.
Add your existing data to Jform Report Builder as a CSV or Excel file. Just upload your file, choose your import settings, and select which type of report you want to generate.
Analyze submission trends or patterns by applying customizable filters to your search results without doing any coding.
Make your visual reports look exactly how you want them to. Customize your layout settings, choose a new color palette, change the chart style, and more.
Show your reports to coworkers, clients, stakeholders, and others. Send a link to your report, embed it in any web page, or simply download and print it out for meetings.
Add a visual report to your website. Embedded reports auto-update when you receive new submissions, so you’ll always see the most up-to-date data.
Copy and paste a report URL to send your form reports to colleagues, clients, or stakeholders. When sharing the link, you can customize the privacy settings to keep your reports secure.
Download or print your report as a PDF document in a few easy clicks. When sharing your report online, you can set permissions to give others the ability to download or print it.
분석
Track Form Submissions with Facebook pixel and optimize your Facebook campaigns.
분석Turn form submissions into visual reports using Jform Report Builder. Generate bar graphs, pie charts, and submission grids automatically. Analyze form data to make better decisions for your company.
분석Set up UTM tracking parameters for your online forms. Track and analyze form traffic data to better optimize your campaigns. Get started now for free!
분석Better analyze your data by connecting your Jform forms with Google Tag Manager and Google Analytics. View analytics for submissions, form fields, thank you pages, and more. Boost conversion rates and make better decisions for your business.
분석Your account is currently limited to {formLimit} forms.
나의 양식들로 가서 기존의 양식을 삭제하거나 양식 제한을 늘리기 위해 귀하의 계정을 업그레이드 하세요.