Create Free Data Charts
Jform’s Data Chart Maker is a tool that lets you create customizable data charts to visualize and present your information clearly. Using this data chart maker, you can transform raw numbers into professional charts, tailor visuals with options like colors and labels, and share or embed your charts for analysis and reporting. The tool supports data conversion and custom reporting without coding, helping you uncover insights and make data-driven decisions.
템플릿
Explore Survey Templates
Social Media Survey

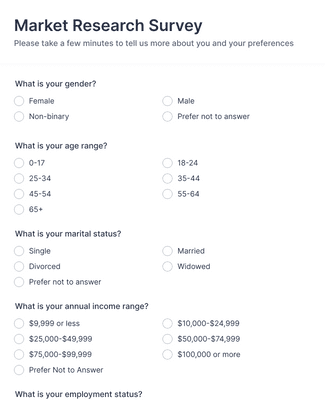
시장 연구 설문조사
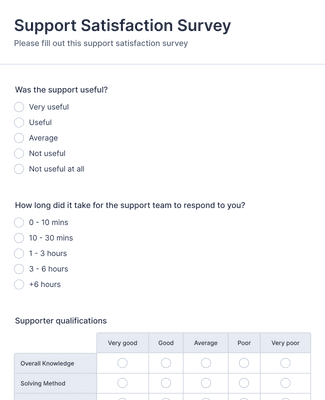
만족도 설문조사 지원
혜택
Instantly Create Data Charts
Seamless data conversion
Jform’s Data Chart Maker lets you visualize your data effortlessly, turning raw numbers into clear, professional-looking charts. Plus, you can generate custom reports to share with your colleagues or stakeholders using Report Builder.
Customizable charts
Tailor your charts to fit your specific needs and preferences with Jform’s drag-and-drop Report Builder. You can customize colors, labels, and other design elements to build charts that align perfectly with your company branding or presentation style.
Embed your data anywhere
Embed reports on your website or social media platforms without any coding so your audience can access your data charts instantly. The best part? Embedded reports will update automatically with each new submission, so you won’t need to constantly update them!
Share your reports in seconds
To speed up your workflows, share your data charts with coworkers, clients, and stakeholders in just a couple of clicks. You can forward reports as a PDF, via email or link, or in a QR code for your convenience.
사용후기
Jform에 대한 사용자의 의견
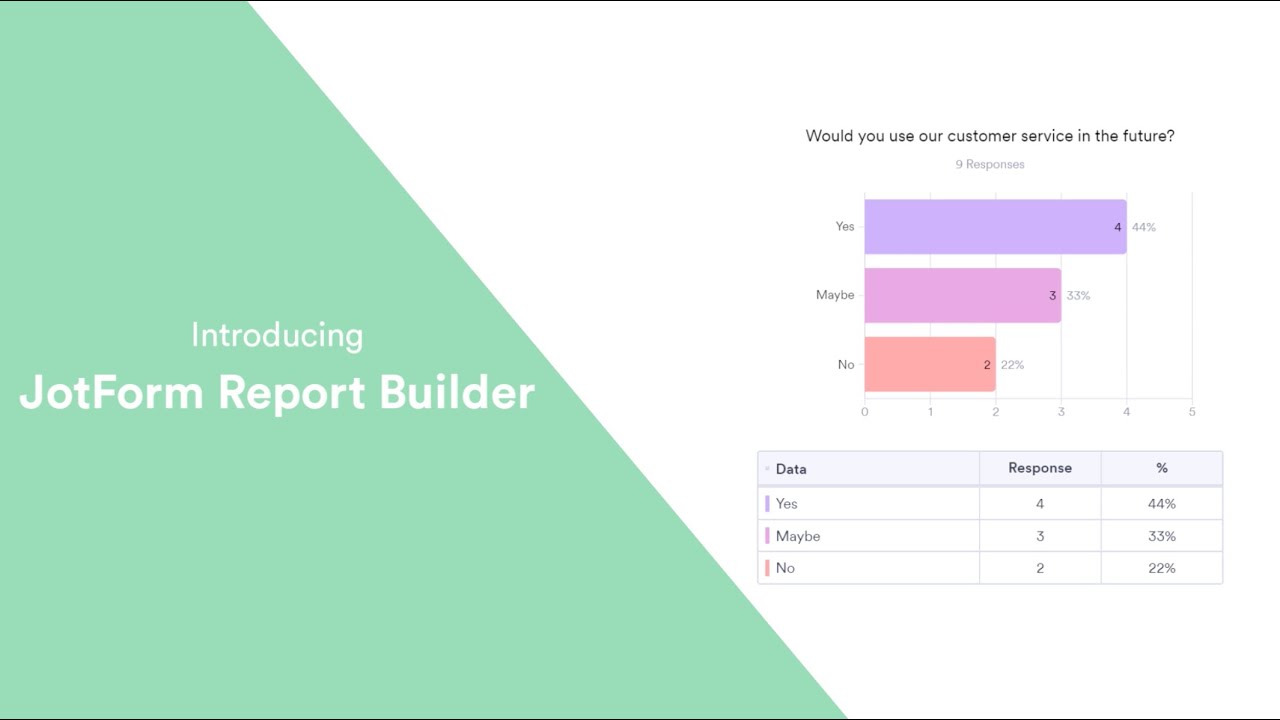
How to use Jform Report Builder
자주 묻는 질문
Jform에 대한 귀하의 모든 질문이 응답되었습니다. 일반적인 질문들에 대한 응답을 위해 자주 묻는 질문들을 확인하거나 더 많은 정보를 위해 저희의 고객 지원팀에 연락해 주십시오.
Is the Data Chart Maker really free to use?
Yes — the Data Chart Maker is free to use and always will be. It’s available on every plan, and there are no limits on the number of reports you can create. Whether you’re on our full-featured free plan, or you’ve upgraded for additional storage or HIPAA features, you can always create professional data charts to showcase your form responses and business status.
How can I create a data chart using the Data Chart Maker tool?
Creating a data chart with the Data Chart Maker is simple. Go to Jform’s Report Builder to get started, or select a form that you want to create a chart for in the form builder. Once you’ve clicked Create New Report, you can select a form, import data, or use a sample report. From there, you can customize the chart to your needs.
Can I customize the appearance of my data charts?
You sure can! With Jform’s drag-and-drop customization features, you can personalize data charts to your liking by changing fonts and colors, updating labels, adding brand elements, swapping rows and columns, and so much more. Report Builder gives you the flexibility to build your survey forms and charts from scratch, or take inspiration from one of our ready-made templates. Need to import data outside of Jform into your charts? You can do that too!
What types of data charts can I create using the tool?
With Jform, you can create several different data charts depending on your needs. These include basic, donut, pie, column, and bar charts, all of which come with optional legends and table grids. You can adjust the data and style of your charts at any time, so you never have to start over if your chart needs updates or adjustments.
How can I share my data charts with others?
You can share your data charts with others via email or link, as a PDF, in a QR code, or by embedding them in your social media accounts or website. Our goal is to make sharing your data as easy as possible, so you can create an impact on your audience and make better business decisions.