Graphs and Charts Widget
Create website-ready charts from simple data
Build responsive chart embeds with editable data rows, multiple chart types, labels, legends, grid controls, and brand-friendly styling.
Create Your Graphs and Charts Widget - It's Free!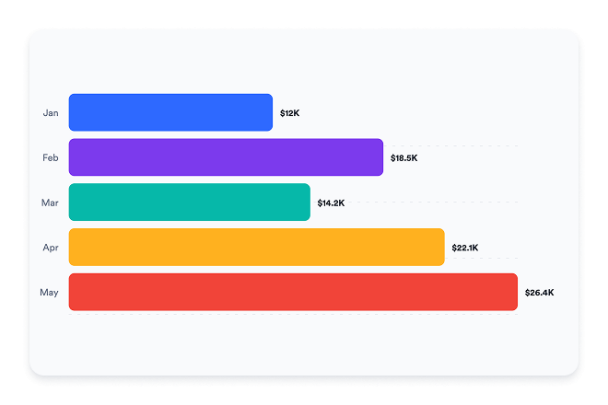

Editable Data Rows
Paste labels, values, and optional colors into the widget settings. The renderer turns those rows into a clean chart immediately.
Data controls include:

Seven Chart Types
Choose bar, column, line, area, pie, donut, or percent bar charts so each dataset can use the right visual structure.
Chart types include:

Readable Labels and Legends
Toggle value labels, legends, grid lines, and rounded bars to help visitors understand the chart without extra explanation.
Display controls include:

Brand-Friendly Styling
Switch between light and dark themes, adjust colors, keep Jform branding visible, and add scoped custom CSS for advanced page-level styling.
Style controls include: